
The quick answer
I have spent a big part of 26 years making software faster — including years squeezing WebGL and web apps to run on slow devices, where a 30% frame-time win was the difference between shipping and shame. The one rule that never changed: you cannot fix what you do not measure.
For most small teams, Sentry is the best default pick. It puts errors and performance in the same place and ties a slow transaction back to the exact line of code, which is what you actually need when something is slow in production.
If you already deploy on Vercel, Vercel Speed Insights gives you real-user Core Web Vitals with basically zero setup. If you want free, privacy-friendly real-user data, Cloudflare Web Analytics is hard to beat.
The shortlist
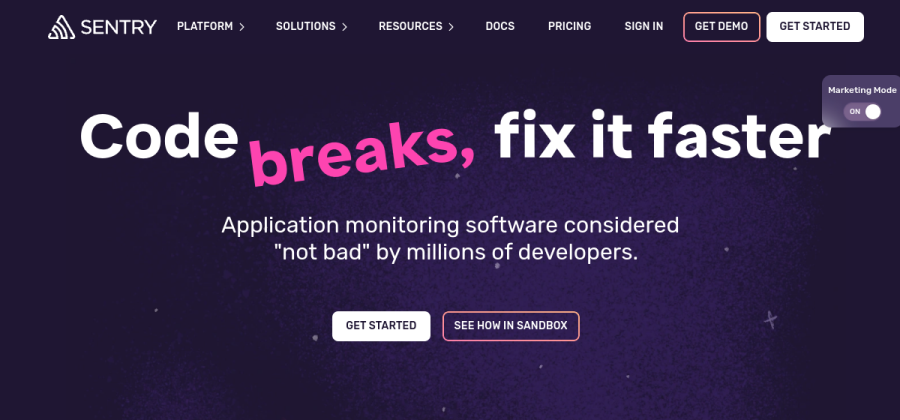
Error and performance monitoring in one tool, with traces that point straight at the slow or broken line of code. The best all-round pick for small teams.
Open SentryReal-user Core Web Vitals for sites deployed on Vercel, with almost no setup. Great if your stack already lives there.
Open Vercel
Focused Core Web Vitals and lab monitoring with scheduled tests, alerts and clear regressions. Affordable and to the point.
Open DebugBear
Polished synthetic and real-user dashboards for teams that treat performance as a first-class product metric.
Open SpeedCurve
Free, privacy-first real-user analytics with Core Web Vitals and no cookies. A painless starting point for any small site.
Open CloudflarePricing, quotas and RUM features move fast in this category. Confirm the current free tier and event limits on the vendor's site before you commit.
How I actually compare them
Performance tools all claim to make your site fast. None of them do — they show you where it is slow. So I compare them on how quickly they get me from “it feels slow” to “here is the exact cause.”
- 1Real users or lab?You need real-user data (RUM). Lab-only tools miss the devices that actually hurt.
- 2Errors too, or just speed?Want both in one place → Sentry. Pure Core Web Vitals → DebugBear or Cloudflare.
- 3Where do you host?On Vercel → Speed Insights is nearly free effort. Anywhere → Cloudflare or Sentry.
- 4Do you need alerts?Regressions should page you, not surprise a customer. Check alerting before buying.
- 5What's the real cost?Price it at your actual traffic. Event-based pricing can jump fast as you grow.
Where Sentry wins
Sentry is my default because it closes the loop. When a page is slow, I do not want a pretty graph — I want the trace, the slow database call and the commit that introduced it. Sentry connects performance data to errors and to source, so debugging is minutes, not a scavenger hunt.
For a small team, having errors and performance in one subscription also means one less tool to pay for and learn.
- Best for: teams that write and ship the code they monitor.
- Skip it if: you only want Core Web Vitals and nothing else — it is more than you need.
Where the others fit
Vercel Speed Insights is the path of least resistance if you deploy there: flip it on, get real Core Web Vitals. DebugBear is the focused pick when Core Web Vitals are the whole job and you want scheduled tests plus alerts without a big platform. SpeedCurve is for teams that treat speed as a product feature and want dashboards they will actually look at. Cloudflare Web Analytics is the free, privacy-first starting line for any site behind Cloudflare.
Common mistakes small teams make
- Measuring only in the lab. Your laptop is not your user. Capture real visitors or you are optimizing a fantasy.
- Watching averages. The average hides the pain. Watch the 75th and 95th percentile — that is where real users live.
- No alerts on regressions. A deploy quietly doubles your LCP and nobody notices for a month. Alert on it.
- Optimizing before profiling. Guessing at the bottleneck wastes days. Measure first, then fix the biggest thing.
Before you commit
- Learn what the numbers mean in Core Web Vitals explained.
- Follow the profile and fix a slow web app workflow with your chosen tool.
- Run every option through the software decision checklist first.
The shortlist at a glance
| Tool | Best for | Verdict |
|---|---|---|
| Sentry | Small teams that want errors and performance in one tool, tied to the exact line of code. | Top pick |
| Vercel Speed Insights | Teams already deploying on Vercel that want real-user Core Web Vitals with zero setup. | Alternate pick |
| DebugBear | Teams that want focused, affordable Core Web Vitals and lab monitoring with alerts. | Alternate pick |
| SpeedCurve | Design- and performance-obsessed teams that want beautiful synthetic + real-user dashboards. | Alternate pick |
| Cloudflare Web Analytics | Teams that want free, privacy-friendly real-user performance data without cookies. | Alternate pick |